Clean, consistent data.
Reviewing files, databases, and KPI definitions. Identifying inconsistencies and designing a reliable reporting model.
Reporting should do more than collect numbers. We connect data sources, define the right KPIs, and turn results into clear, actionable insights.
From organising raw data to creating reports your whole team can use. Every engagement is tailored to your questions, data sources and audience.
Reviewing files, databases, and KPI definitions. Identifying inconsistencies and designing a reliable reporting model.
Interactive reports for sales, finance, and operations, with intuitive filters, clear metrics, and easy navigation.
Cleaning, joining, and validating data. Repeatable processing, refresh pipelines, and quality checks.
Track results by product, channel, and period — without hunting for discrepancies across spreadsheets.
Monitor volumes, turnaround times, team workload, and process bottlenecks.
Budget-versus-actual comparisons, trends, costs, and consistent definitions of key metrics.
Standardised recurring reports with less manual preparation.

We identify the audience, business questions, and available data sources.
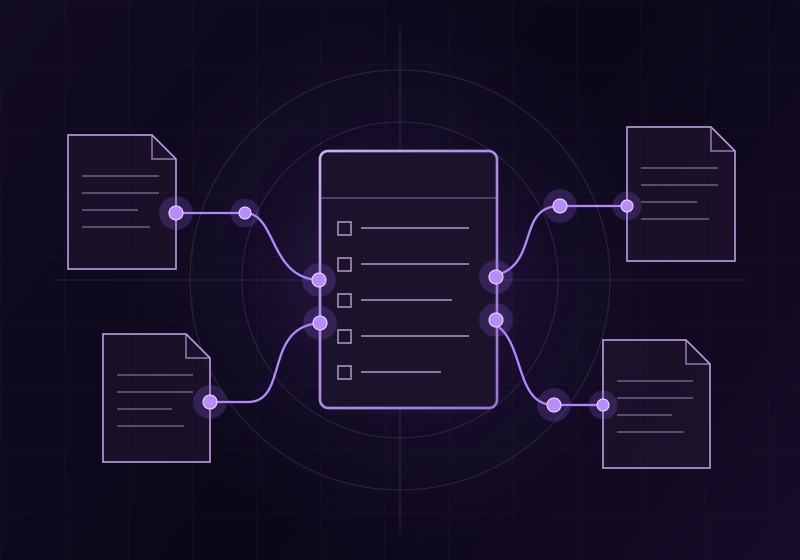
We check data quality, relationships, and metric definitions.
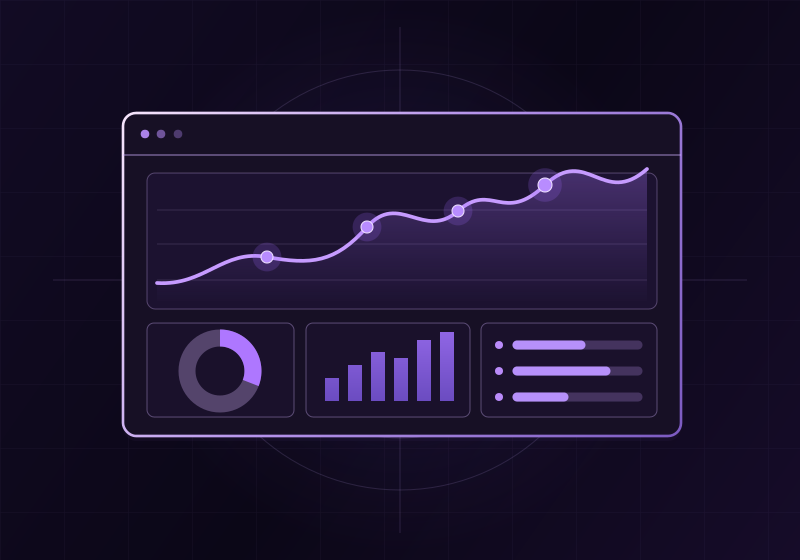
We build visualisations and refine how results are presented.

Testing, documentation, and a defined data refresh process.
No. We review the tools you already use before recommending a reporting platform.
Yes. Spreadsheets can be a data source. We'll need to assess their structure and consistency before providing a quote.
We agree on access requirements, follow least-privilege principles, and never publish client data in demos.
Tell us about the problem you want to solve. We'll discuss the available data, existing tools, goals and potential scope.
Let's Talk DataBefore getting in touch, please read our privacy policy.